|
Visual
Architecting Process™
Action Guides
-
Init/Commit
-
Meta-architecture
-
Requirements
-
Specification
-
Conceptual Architecture
-
Requirements
-
Specification
- Logical Architecture
- Execution Architecture
- Architecture Deployment
Other
Columns
i. Architecture
Teams (.pdf)
ii. Minimalist
Architecture (.pdf)
Related
White Papers
i. Software
Architecture (.pdf)
ii. Visual
Architecting Process (.pdf)
iii. Architecture
as Business Competency (.pdf)
For more on Architecture
Action Guides see
i. Downloads
ii. Software Architecture
Workshop
For more on
Architecting see
Architecting
Process
Book
List
|
 System System
And Software Visualization
Resources
Thanks to all who contributed over time to this collection. And thanks in advance for letting
us know about any visualization techniques,
tools and discussions and other resources that are still missing from this
collection!!
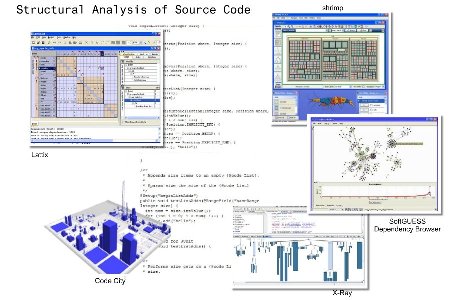
I composed the image (right) with snips from
Lattix,
Shrimp,
SoftGUESS,
X-Ray and
CodeCity.
Architecture Decision Frameworks or View Models
Software Architecture
Systems Architecture
Enterprise Architecture
General
Proprietary-large company
-
Capgemini’s Integrated Architecture Framework (IAF)
-
IBM’s Architecture Description Standard (ADS)
-
SAP Enterprise Architecture Framework (EAF)
-
Oracle Enterprise Architecture Framework (OEAF)
Thought leaders
-
Gartner Enterprise Architecture Framework
-
VAP
Enterprise Architecture Decision Framework
- Orr’s Business Enterprise Architecture Modeling Framework (BEM)
- Extended Enterprise Architecture Framework (E2AF)
- Pragmatic Enterprise Architecture (PeaF)
- OBASHI
Educational institutions
-
Purdue Enterprise Reference Architecture (PERA)
Government and State Agency
Government--Defense
Notation Standards for Software and System Visualization
Other Notations for Software and Systems Visualization
Architecture Visualization and Documentation Practices
Architecture Visualization and Documentation Positions
Software Architecture: Central Concerns and Key Decisions and
Software Architecture Documentation Action Guides, Bredemeyer Consulting
Tools
UML tools
sysML tools
ArchiMate tools
MDE and Visual DSL tools
Powerpoint (the most used architecture drawing tool?)
,
Edward Tufte
Don Norman
In
Defense of Powerpoint
Tools for
visualizing and managing code structure/dependencies, design rule
enforcement, etc.:
 Component
Connectivity (for COBOL), Semantic Designs Component
Connectivity (for COBOL), Semantic Designs
Lattix
(pioneered the use of DSMs in software visualization)
NDepend (great
blog too!) and
cppDepend
Axivion
Bauhaus
Software Acumen
Bauhaus
SonarJ and
Sotoarc/Sotograph
Structure101
JDepend
IntelliJ IDEA (JetBrains) includes a DSM (Dependency Structure Matrix)
feature
dtangler
XRadar (opensource)
System Grokker,
IBM
Coverity Architecture Analysis
Klockwork Insight
SolidSX (Solid Software Xplorer)
SoftGUESS
(built on
GUESS):
code clone genealogy, encapsulation and dependency browser
SourceInsight (for C, C++,
C# and Java): program editor and can display reference trees, class
inheritance diagrams, and call trees
SciTools: source code analysis
and metrics for large, complex amounts of source code
CrystalFlow from
SVGsarc: flow
charts from source code
Architecture visualization in VS 2010 (Microsoft)
Level 7 Visualizations: Supermodel
is a 3D animated immersive world;
Superplex is an associative-store navigation network based on mind-mapping
Tools for visualizing metrics
DSM (Design Structure Matrix,
also known as Dependency Structure Matrix and Dependency Structure Method) tools with broader
application (the set above focus on software systems):
University Projects In Software Visualization:
-
Chisel projects at the
University of Victoria:
Shrimp (visualize "graph based" data formats), Jambalaya (uses Shrimp to
visualize knowledge bases; rides on the
Protégé
ontology editor from Stanford),
Creole (explore Java code
visually; uses Shrimp). Shrimp can be downloaded from
SourceForge.
Other Chisel projects that look interesting include:
ConcernLines,
SequenceExplorer,
Model Driven Visualization (Zest
for Eclipse), and
TagSEA (cool
use of social tagging to create "geographical landmarks" in code).
MOOSE analysis environment (Software
Composition Group at University of Berne) supports a number of
research projects such as
Viz: Polymetric views. The
Viz:
distribution map looks like if could be promising, though I'd want to be
clearer what was being color coded (properties? concepts? concerns?
responsibilities?) The whole area of
evolution modeling is worth a look. There are numerous very interesting
visualization tools in the MOOSE set, including
DynaMoose (feature map/analysis),
Enriched DSM,
Chronia (file ownership over time) and
SmallDude (duplication detector).
iPlasma projects, at
University of Timisoara, Romania:
MemBrain,
JMondrian (Java
implementation of the Mondrian visualization framework).
POLKA
from
GA Tech CS (Algorithm Animation)
SeeSoft GA Tech;
Gammatella, GA Tech.
Gammatella does remote monitoring by
combining execution metrics, colored treemaps and SeeSoft-like views
Tarantula (visualization for fault localization), GA Tech
MORALE (Mission ORiented Architectural Legacy
Evolution)
toolset from
GA Tech (vintage 1999)
VizMOOS, (Visualization Methods for Object Oriented Software Systems)
and
J3Brower, University of Dortmund
sv3d
CodeSwarm,
StarGate,
Visualizing Eclipse Bug Data, Software visualization
projects at UC Davis
Visual Code Navigator
(CVSscan, CVSgrab, CSV, DreamCode), TUE, The Netherlands (vintage 2007)
Alex Telea,
Visual
Gallery, TUE, The Netherlands; and
papers on
visualization topics including code evolution
Software
Visualization: VALLEY, CACTI, BLOOM, JIVE (visualizes execution history
using interactive UML sequence diagrams), JOVE, VELD, Brown University
|
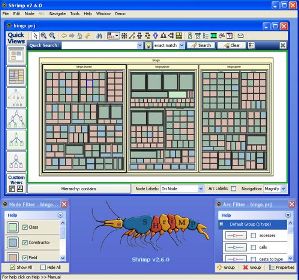
Shrimp image source:
http://www.thechiselgroup.com/shrimp
|
Performance prediction:
-
Cheddar:
responsiveness and schedulability assessment using analytical techniques and
execution simulation (Cheddar-University of Brest)
- Lockheed Martin CSIM Event Driven Modeling Tool (described
here)
Profilers and Performance Diagnostics
-
JProbe: Memory, performance
and coverage analysis
-
Apache JMeter: simulate
a heavy load on a server, network or object to test its strength or to
analyze overall performance under different load types
Model recognition:
Miscellany (related to software):
Ontology visualization:
Graph visualization (and applications):
Information visualization and visual analysis tools:
Toolsets and libraries for visualization:
-
ilog--graphics
libraries for creating complex data visualizations
-
Processing--an open source programming language and environment to
program images, animation, and interactions
(Universe uses
Processing)
-
Collada--enabling digital asset exchange for interactive 3D industry
-
prefuse information visualization
toolkit (Jeff Heer, now at
Stanford)
-
ThinkMap SDK
-
Protovis: a graphical toolkit for visualization (Stanford)
- V3ga
Vision factory: relies
on several third-party libraries and has numerous facets making it a rich
framework for the experimentation and the creation of visuals
-
Raphaël—JavaScript Library (vector
graphics)
Performance visualization:
Visualization in requirements and user interaction design:
Interesting developments in interactive (input) devices (supporting team
visualization):
Interesting developments in diagramming tools:
(some points of differentiation: i. online apps/diagramming in the browser ii.
collaboration iii. you write, the tool draws)
-
LucidChart: collaboratively
create and work on flow charts and org charts online
-
Creately: online drawing tool to draw
flowcharts, UML diagrams, wireframes and UI mockups, etc., and share them
online
-
webSequenceDiagrams:
enter interaction description, and tool draws the diagram
Collaborative whiteboard tools
Concept Mapping
-
VUE: Visual Understanding
Environment from Tufts; import ontologies defined in RDF-S or OWL formats
directly into VUE, allowing for the creation of concept maps from
pre-defined object and relationship types. Merge maps has nice features for
analysis.
Mind mapping tools (branching mind map tools can be used for
informal concept maps, dependency trees, feature trees, utility trees,
system quality refinement/scenarios, etc.; tabular mind maps can be used for
brainstorming lists a la Think Better. etc. So not just for Buzan-styled
mind maps... though those are great too.)
- List of
mind
mapping tools on wikipedia
- Mindmeister: collaborative online mindmapping (limited edition is free)
-
Mind42: free collaborative online
mindmapping
-
XMind: open source, free download;
public sharing is free
General: Software Visualization
Illustrative Examples
Visualizing the future (roadmaps and projections or forecasts)
-
Roadmap
to Secure Control Systems in the Energy Sector (One of the best roadmap
examples I've found, combining plan and projection, scenarios and visuals to
support the visualization of the future.)
-
Future of Software and Systems Engineering (This was done in 2005, and
it is interesting in providing an example of looking back to provide context
for looking forward, as well as interesting in how quickly the landscape and
forces have shifted even from the projections in 2005.)
-
Unmanned Aerial Vehicles Roadmap: 2002-2027. (Done in 2002, but
looking 25 years out! This is a dependencies and planning kind of roadmap.
Heavily textual, but I like the diagrams on page 35-37, and the subsequent
discussion of enablers/capabilities provides a good illustration of
architectural forward-thinking.)
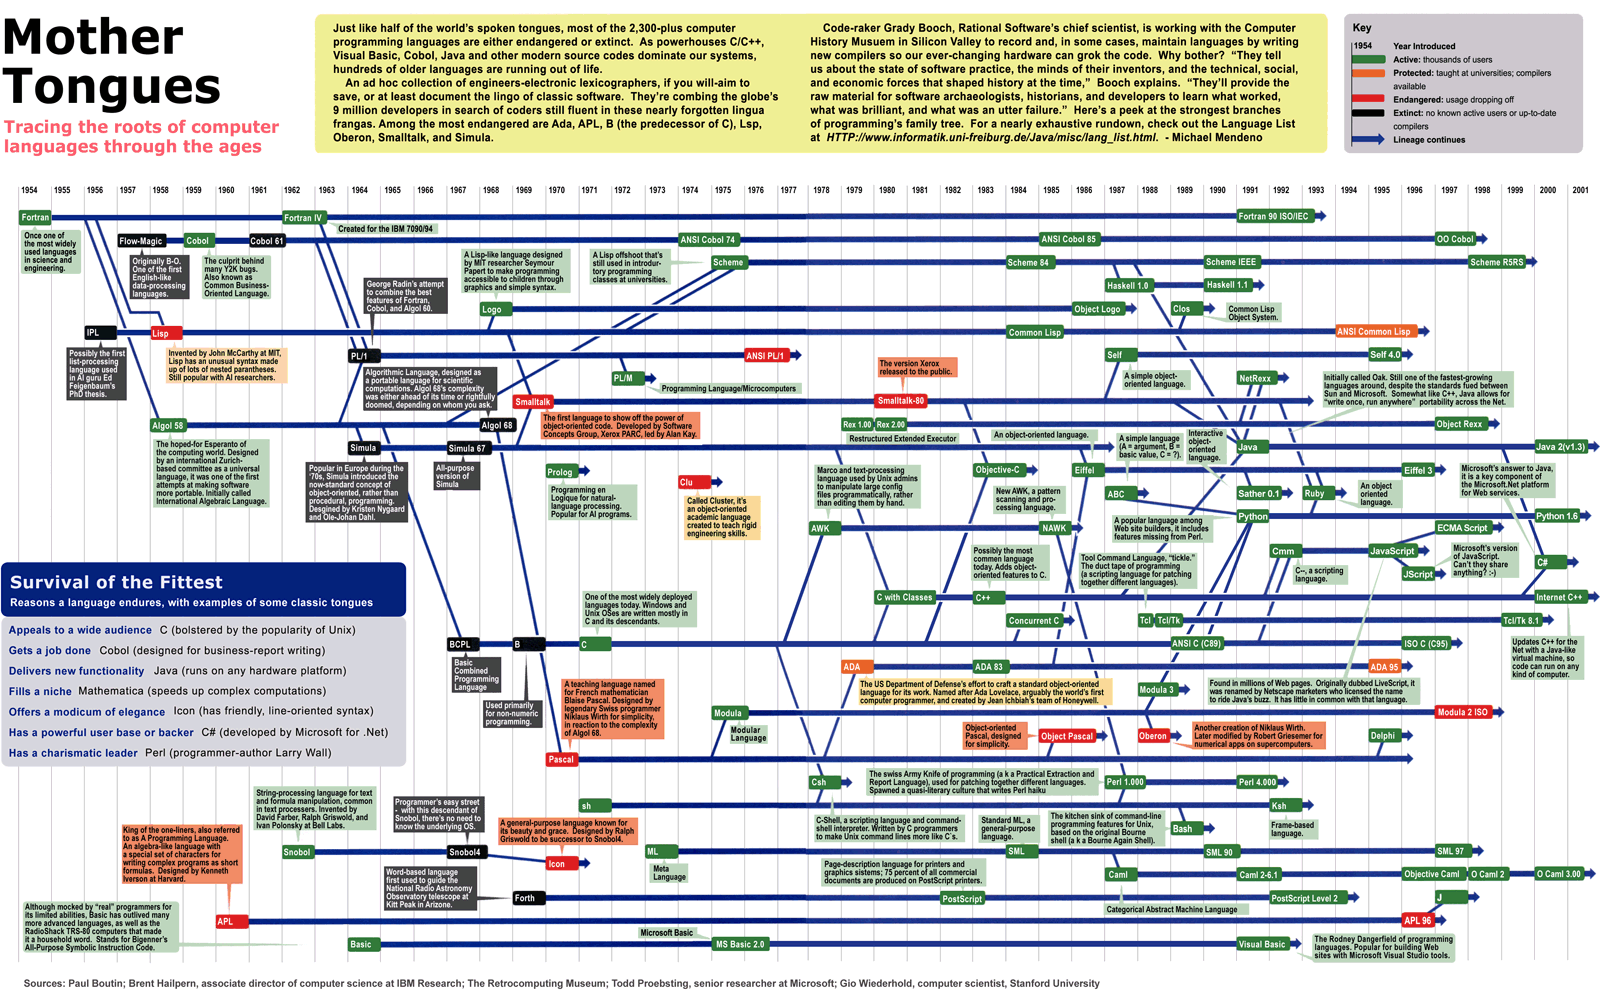
Visualizing the past (graphical histories)
Rich Pictures
Visualizing social networks
Neat applications of comics to software/technology
Google
Chrome Comic
Srikwan and Markus Jakobsson's
security cartoon
Animation applied to teaching software/related concepts
Visualizing techniques applied to create humor
Relationship visualization (by example)
-
Music maps: The closer two
artists are, the greater the probability people will like both artists.
-
Wordle: visualize word density on a
web page (size proportional to word count)
Just for fun
Visualization in Collaboration
Graphical facilitation and graphical recording:
Visualization in Business and Competitive Intelligence
Visualization in Other Fields
DSM (Design/Dependency Structure Matrix) applications in other fields:
-
Acclaro DFSS
product design (not software specific), from Axiomatic Design
Not software-specific, but interesting:
-
visualcomplexity --
super-awesome collection of visualization
projects, styles, and resources. WOW! It is stunning to see what people are
doing!
-
Information Aesthetics spotlights
info visualization sites
-
Sankey Diagrams--specific type
of flow diagram, in which the width of the arrows is shown proportionally to
the flow quantity
-
SimpleComplexity.net: surveys
information visualization techniques and sites
-
"periodic table" of visualization
-
Visual Think Map's assorted collection visualizations (gives an
impression of the gamut of ideas)
- The visualizations on GOOD.is are really phenomenal/disturbing! If TED
is the place to go to see exemplary speeches, GOOD.is the place to go to see
data visualization and meaning making through visuals! Actually there are
some cool data visualization talks on TED (Gosling included).
- Wolfram (of A New Kind of Science fame)
Demonstrations Project:
over 5000 interactive visualizations! For example, experiment with
Amdahl's Law.
-
50 Great examples of InfoGraphics
-
A new graphic visualization of the
periodic table.
Interesting developments in visualization:
Visualization in Product Design
Visualizing Social Networks
Transportation
Visualization in Climate Change Fields
Visualization in Bio-Informatics
Visualization in Bio-Medical Fields (Anatomy, Physiology, etc.)
Visualization in Math and Science
Visualizing Music
Academic Work in Visualization (General Applications, not only software)
Books
Visualization in Engineering Disciplines:
- Henderson, Kathryn,
On Line and On Paper: Visual
Representations,
Visual Culture, and
Computer Graphics in Design Engineering, 1998
- Ferguson, E.
Engineering and the Mind's Eye. Cambridge,
Massachusetts: MIT Press, 1994.
- Petroski, H.
Invention by Design: How Engineers Get From Thought to Thing.
Boston, Massachusetts: Harvard University Press, 1996.
Visualization in Software:
- All the UML and sysML books!
- Diehl, Stephen,
Software Visualization - Visualizing the Structure,
Behavoiur, and Evolution of Software. Springer, 2007
- Michele Lanza and Radu Marinescu, Object-Oriented Metrics in
Practice: Using Software Metrics to Characterize, Evaluate, and Improve the
Design of Object-Oriented Systems, Springer, 2006
- Stasko, J. T., Brown, M. H., & Price, B. A.,
Software Visualization:
MIT Press, 1997
Visualization in Design:
Information Visualization:
Visualizing in Decision Making, Thinking and Communication (applied to
business and life):
Drawing to visualize concepts (used in graphical facilitation and
illustration):
Talks and Video Clips on Visual Thinking and Visualizing Systems
Interviews on SE radio related to structure visualization:
Interviews on InfoQ related to modeling:
Source code analysis tools (not really visual, but important):
Visualizing in Software and Systems Development
Visualizing in Business and Society:
Dan Roam,
Back of the Napkin talk at Google
Hans Rosling's TED talks:
shows best stats you've ever seen and
new insights on poverty
Interesting developments in interactive visualization input devices:
Lessons in Making Things Visual:
Drawing to visualize concepts:
History
- George Dyson
on the birth of the computer (TED) (not much on visualization, but the
early history of binary logic, and some neat illustrations and comments in
those old note books!)
Articles, Blogs an Blog Posts on Software Modeling and Visualizing
Drawing on the Walls--It's not just for kids! (7/22/08)
--
Visual Modeling (7/16/08)
--
Ban Powerpoint? (5/9/09)
--
Testing on Paper (5/12/09)
--
Hand-rendering your vision (7/15/08)
Wikipedia "Software
Visualization"
Scott Ambler:
-
Artifacts for Agile Modeling: The UML and Beyond
-
Use
the Simplest Tools
-
Architecture Envisioning: An Agile Best Practice
Michael Bushe,
IntelliJ IDEA's Dependency Structure Matrix Tool Visualizes
Architecture, InfoQ, 2/12/08
Johan Den Haan,
8 Reasons
Why Model-Driven Approaches (will) Fail, InfoQ, 7/28/08
Sven Efftinge, Peter Friese, Jan Kohnlein,
Best
Practices for Model-Driven Software Development, InfoQ, 6/25/08
Niclas Nilsson,
Is a picture
always worth a thousand words?, InfoQ, 8/11/07
Presentations on Software Architecture Visualization
- Visualizing Software Architectures:
Part I and Part II, Richard Taylor, Nenad Medvidovic and Eric Dashovy,
USC
Papers on Software Modeling and Visualizing
-
Software development: speeding from sketchpad to smooth code, ICT
Results, 7/30/09
-
T. Ball and S. Eick. Software visualization in the large. IEEE Computer,
pages 33–43, 1996.
-
K. Delhi Babu, Dr. P.
Govindarajulu and A.N. Aruna Kumari,
Development of
the Conceptual Tool for Complete Software Architecture Visualization: DArch
(DA), IJCSNS International Journal of Computer Science and Network
Security, VOL.9 No.4, April 2009
-
Dirk Beyer and Ahmed E. Hassan,
Evolution Storyboards: Visualization of Software Structure Dynamics,
2006
-
Weiwei Cui,
A Survey on Graph
Visualization, 2007
-
Remco C. de Boer, Patricia Lago,
Alexandru Telea, and Hans van Vliet,
Ontology-Driven Visualization of Architectural Design Decisions, WICSA
2009.
-
De Pauw, W., Jensen, E., Mitchell, N., Sevitsky, G., Vlissides, J., and
Yang, J., Software Visualization, State-of-the-Art Survey. LNCS 2269,
Stephan Diehl (ed.), Springer Verlag, 2002
-
Duszynski, S.; Knodel, J.; Lindvall, M. , SAVE: Software Architecture
Visualization and Evaluation, 13th European Conference on Software
Maintenance and Reengineering, CSMR 2009. Proceedings : Architecture-Centric
Maintenance of Large-Scale Software Systems, March 24-27, 2009
-
Grundy, J.; Hosking, J. High-Level Static and Dynamic Visualization of
Software Architectures, Proceedings of 2000 IEEE Symposium on Visual
Languages, p.5-12.
-
Izurieta, Clemente and James M.
Bieman, How Software Designs Decay: A Pilot Study of Pattern Evolution,
ESEM’07, September 20–21, 2007
-
Benjamin Kurtz, SOFTVIZ: A
RUNTIME SOFTWARE VISUALIZATION ENVIRONMENT, masters thesis, 2002
-
Kuhn, A., and Greevy, O., “Exploiting
the Analogy Between Traces and Signal Processing,” Proceedings IEEE
International Conference on Software Maintenance (ICSM 2006), IEEE Computer
Society Press, Los Alamitos CA, September 2006.
-
Gallagher, Keith, Andrew Hatch and Malcolm Munro, Software Architecture
Visualization: An Evaluation Framework and Its Application, IEEE
Transactions on Software Engineering, vol. 34, no. 2, pp. 260-270,
March/April, 2008.
-
Langelier, Guillaume, Houari Sahraoui and Pierre Poulin,
Visualization-based analysis of quality for large-scale software systems,
Proceedings of the 2003 ACM symposium on Software visualization, 2003
-
Marcus, A., Feng, L., & Maletic, J. I. (2003).
3D representations for software visualization. Paper presented at the Proceedings of the 2003 ACM
symposium on Software visualization, San Diego, California. [Sv3D:
3D software visualization]
-
Meyer, Michael et al., "Mondrian:
An Agile Information Visualization Framework," Proceedings of ACM
Symposium on Software Visualization (SoftVis 2006)
-
Ogawa, Michael and Kwan-Liu Ma,
StarGate: A Unified, Interactive Visualization of Software Projects,
2008 ?
-
Panas, Thomas, Thomas Epperly,
Daniel Quinlan, Andreas Saebjornsen, Richard Vuduc, "Communicating Software
Architecture using a Unified Single-View Visualization," iceccs, pp.217-228,
12th IEEE International Conference on Engineering Complex Computer Systems (ICECCS
2007), 2007
-
Ren, Jie , Richard N. Taylor,
Visualizing Software
Architecture with Off-The-Shelf Components,
-
Sawant, Amit Prakash and Naveen
Bali,
MultiVizArch: Multiple Graphical Layouts for Visualizing Software
Architecture, ACM, 2004
-
Sensalire, Mariam, Patrick Ogao,
Alexandru Telea,
Classifying Desirable Features of Software Visualization Tools for
Corrective Maintenance, SoftViz08
-
Sillanpää, Matti and Alexandru
Telea,
DEMONSTRATION OF THE SOFTVISION SOFTWARE VISUALIZATION FRAMEWORK, 2004
-
Staples, M. L., & Bieman, J. M. (1999). 3-D Visualization of Software
Structure. In Advances in Computers (Vol. 49, pp. 96–143): Academic Press,
London.
-
Storey, M.-A. D. , D. Cubranic,
and D. M. German. On the use of visualization to support awareness of human
activities in software development: a survey and a framework. In SoftVis
'05: Proceedings of the 2005 ACM symposium on Software visualization, pages
193-202. ACM Press, 2005.
-
Van Rysselberghe, F. (2004). Studying Software Evolution Information By
Visualizing the Change History. Proceedings. 20th International Conference
On Software Maintenance. pp 328–337, IEEE Computer Society Press, 2004
-
Wettel, R., and Lanza, M., Visualizing Software Systems as Cities. In
Proceedings of VISSOFT 2007 (4th IEEE International Workshop on Visualizing
Software For Understanding and Analysis), pp. 92 – 99, IEEE Computer Society
Press, 2007.
-
Nenad Medvidovic and David S.
Rosenblum,
Domains of
Concern in Software Architectures and Architecture Description Languages,
[See Table 1--vintage '97 I think, but a nice idea]
Papers on Model Driven Performance/QoS Analysis
-
Sohel Aziz, Gaurav Caprihan, Kingshuk Dasgupta, and Stephen Lane,
Performance Engineering and Global Software Development, Infosys white
paper, Jan 2007
-
Gabriel A. Moreno and Paulo Merson, "Model-Driven
Performance Analysis," Fourth International Conference on the Quality of
Software Architectures (QoSA 2008). Germany, October 14-17, 2008.
-
Assel Akzhalova, Assel Altayeva and Nurzhan Duzbayev,
Model Driven
Prediction and Control, Journal of Object Technology, December
2007.
-
Simonetta Balsamo, Antinisca Di Marco, Paola Inverardi, and Marta
Simeoni. Model-based performance prediction in software development: A
survey. IEEE Transactions On Software Engineering, 30(5):295{310, May 2004.
-
Balsamo, S. and M. Marzolla. Performance Evaluation of UML Software
Architectures with Multiclass Queueing Network Models. in WOSP 2005. 2005.
Palma de Mallorca: ACM.
-
Bass, L., Ivers, J., Klein, M., Merson, P.: Reasoning frameworks.
Technical Report CMU/SEI-2005-TR-007, Software Engineering Institute (2005)
-
Kenneth Chan and Iman Poernomo, QoS-aware model driven architecture
through the UML and CIM. Information Systems Frontiers, 9(2-3):209{224,
2007.
-
Luiz Marcio Cysneiros and Julio Cesar Sampaio do Prado Leite.
Nonfunctional requirements: From elicitation to conceptual models. IEEE
Transactions On Software Engineering, 30(5):328{350, MAY 2004.
-
D'Ambrogio, A. A Model Transformation Framework for the Automated
Building of Performance Models from UML Models. in Proc. 2005 Workshop on
Software and Performance. 2005. Palma de Mallorca: ACM Press.
-
Ivers, J., Moreno, G.A.: Model-driven development with predictable
quality. In: Companion to the OOPSLA'07 Conference. (2007)
-
López-Grao, J.P., J. Merseguer, and J. Campos. From UML Activity
Diagrams to Stochastic Petri Nets: Application to Software Performance
Engineering. in Proc. Workshop on Software and Performance. 2004. Redwood
Shores, CA: ACM.
-
Liu, V., I. Gorton, and A. Fekete, Design-level performance prediction
of component-based applications. IEEE Trans. on Software Engineering, 2005.
31(11): p. 928-941.
-
Hissam, S.A., G.A. Moreno, and K.C. Wallnau, Using containers to enforce
smart constraints for performance in industrial systems. 2005, Software
Engineering Institute - Carnegie Mellon University: Pittsburgh, PA.
-
Ivers, J. and G.A. Moreno. Model-driven development with predictable
quality. in SIGPLAN Conference on Object Oriented Programming Systems and
Applications (OOPSLA07). 2007. Montreal, Quebec, Canada: ACM.
-
Gabriel A. Moreno, Connie U. Smith, and Lloyd G. Williams,
Performance
Analysis of Real-Time Component Architectures: A Model Interchange
Approach, WOSP’08, June 24–26, 2008, Princeton, New Jersey, USA.
-
Liangzhao Zeng, Boualem Benatallah, Anne H.H. Ngu, Marlon Dumas, Jayant
Kalagnanam, and Henry Chang. Qos-aware middleware for web services com-
position. IEEE Transactions On Software Engineering, 30(5):311{327, MAY
2004.
Papers on Software Visualization Practices
-
Mauro Cherubini, Gina Venolia,
and Rob DeLine,
Building an Ecologically-valid, Large-scale Diagram to Help Developers Stay
Oriented in Their Code, September 2007
-
Mauro Cherubini, Gina Venolia,
Rob DeLine, and Andrew J. Ko,
Let's go to the whiteboard: how and why software developers use drawings,
May 2007
-
Thomas D. LaToza, Gina Venolia,
and Robert DeLine,
Maintaining mental models: a study of developer work habits, May 2006
-
Carl Hinsman, Neeraj Sangal, and
Judith Stafford,
Achieving Agility through Architecture Visibility (LL Bean -- Lattix
case study), QoSA 2009, LNCS 5581, pp. 116–129, 2009.
Papers on Information
Visualization
Conferences in Software Visualization
Alternatives to Visual Language Approaches in Software
express your design intent in a textual
DSL specification, from which Sculptor generates high quality Java code and
configuration (open source)
Xtext:
a framework for developing textual DSLs (based on
Eclipse)
Visual Modeling of Business Processes
Graphical Language/Notation Standards
-
IDEF0: method designed to
model the decisions, actions, and activities of an organization or system
-
BPMN: Business Process Modeling
Notation--OMG standard; subsumes BPMI (Business Process Modeling Management
Initiative)
Visual Language in other Disciplines
-
Orchesography by Thoinot Arbeau: annotation for drum beats on the
music score and an annotation for the dance steps, as well pictures of
dancers showing the costumes and footwork
-
labanotation:
visual language for dance
- Akira Yoshizawa created an instructional language for origami. (Robert
Lang on origami on TED)
Papers and Collections of Papers on Visualization and Visual Thinking
Visualizing (and Illustrating) Quotes
"The eye can process information in the ratio of 12:3 times faster than the
ear." --
structured visual thinking
(You do see the humor in that, right? 12:3 times is so much more compelling a
visualization than 4 times... :-)
Hemmingway coined the term "illustrating the iceberg" in reference to his
writing, but as a principle it is applicable to visually illustrating a system:
"In The Old Man and the Sea,
Hemingway uses a technique of writing in which only the necessary
information is provided. He called it illustrating the iceberg." --
Ryan Bredemeyer, 5th Grade Book report on
A Sea of Change, May
2009
"If a writer knows enough about
what he is writing about, he may omit things that he knows. The
dignity of movement of an iceberg is due to only one ninth of it
being above water." -- Ernest Hemingway, Death in the Afternoon,
1932
On drawing:
"...John Ruskin. His mission
was not to teach people how to draw, but how to see." Niamh Sharky,
Everyone Can Draw For Fun: Visualizing
Abstract Concepts
For Fun (and my own moral support): Bringing Back Hand-Drawn Designs
Performance Testing
Load testing:
"There are open source tools like
JMeter that work pretty well. They are not suited for really high volume load
tests, but they work pretty well for testing as you go and checking to see when
you introduce a performance regression. It is possible to do more of that on a
continuous basis."
Michael Nygard, InfoQ
JMX
Code Spelunking (some visual, some not)
Here is George Neville-Neil's take on several spelunking resources (circa
2003):
"Global:
Global is really a pair of tools: gtags and htags. The
first, gtags, builds a database of interesting connections based on a source
tree in C, C++, Java, or Yacc. Once the database is built, you can use your
editor (both Emacs and vi are supported) to jump around within the source. Want
to know where the function you're calling is defined? Just jump to it. The
second tool is htags, which takes the source code and the database generated by
gtags and creates an HTML-browsable version of the source code in a
subdirectory. This means that, even if you don't use Emacs or vi, you can easily
jump around the source code finding interesting connections. Building the
database is relatively speedy, even for large code bases, and should be done
each time you update your sources from your source-code control system.
Cscope:
Cscope was originally written at AT&T Bell Labs in the 1970s. It answers many
questions, such as: Where is this symbol? Where is something globally defined?
Where are all the functions called by this function? Where are all the functions
that call this function? Like Global, it first builds a database from your
source code. You can then use a command-line tool, Emacs, or one of a few GUIs
written to work with the system to get your questions answered.
gprof:
This is the standard profiling tool on most open source
Unix systems. Its output is a list of routines ordered by how often they were
called and how much of the program's CPU time was spent executing them. This can
be useful in figuring out where to start looking for security holes in a
program.
code spelunking:
This Web site contains a TWiki collaboration page
dedicated to code spelunking"
-- George V. Neville-Neil,
Code Spelunking: Exploring Cavernous Code Bases , ACM
Queue, September, 2003
See also
Code Spelunking
Redux, by George V. Neville-Neil, January 8, 2009
|
